Data Catalogue
Historical reference
What happened. Observation-forced, for validation and attribution.
Scenarios
What could happen. GCM-forced, baseline plus three SSPs.
Quality assurance
Simulation quality information.
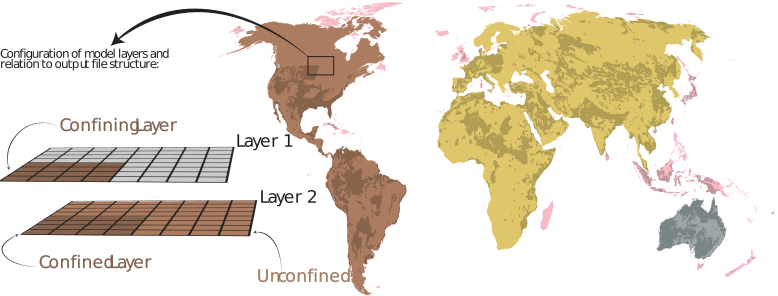
GLOBGM is a two-layer groundwater model, with outputs available for both layers. Properly interpreting these layers is essential for selecting the appropriate data in your analysis.
The aquifer type at any location is determined by the data presence in each layer:
Confined System: Occurs where Layer 1 contains valid data, representing the confining layer (aquitard), with Layer 2 data corresponding to the underlying confined aquifer.
Unconfined System: Identified where Layer 1 is null (no data) and Layer 2 has valid data, indicating an unconfined aquifer in Layer 2.
Historical reference
Forcing
GSWP3-W5E5 (observational)
Period
1960–2019
Members
Single run, no ensemble
Recommended use
Validation, attribution
Archive
YODA landing page
Loading ITables v2.9.1 from the init_notebook_mode cell...
(need help?)
|
Scenarios
Forcing
5 CMIP6 GCMs, bias-corrected
Baseline
CMIP6 historical, 1960–2014
Projections
SSP1-2.6, SSP3-7.0, SSP5-8.5, 2015–2100
Loading ITables v2.9.1 from the init_notebook_mode cell...
(need help?)
|
| ⓘMember | Period | Scenario | Aggregation | Variable | Size (GiB) | Download |
|---|---|---|---|---|---|---|
| Ensemble | 1960–2014 | CMIP6 historical | Average | Head | 5.38 | Download |
| Ensemble | 1960–2014 | CMIP6 historical | Average | Water table depth | 5.38 | Download |
| Ensemble | 1960–2014 | CMIP6 historical | Annual | Head | 43.98 | Download |
| Ensemble | 1960–2014 | CMIP6 historical | Annual | Water table depth | 50.44 | Download |
| Ensemble | 1960–2014 | CMIP6 historical | Monthly | Head | 526.28 | Download |
| Ensemble | 1960–2014 | CMIP6 historical | Monthly | Water table depth | 603.83 | Download |
| Ensemble | 2015–2100 | SSP1-2.6 | Average | Head | 5.38 | Download |
| Ensemble | 2015–2100 | SSP1-2.6 | Average | Water table depth | 5.38 | Download |
| Ensemble | 2015–2100 | SSP1-2.6 | Annual | Head | 68.92 | Download |
| Ensemble | 2015–2100 | SSP1-2.6 | Annual | Water table depth | 78.81 | Download |
| Ensemble | 2015–2100 | SSP1-2.6 | Monthly | Head | 826.19 | Download |
| Ensemble | 2015–2100 | SSP1-2.6 | Monthly | Water table depth | 945.04 | Download |
| Ensemble | 2015–2100 | SSP3-7.0 | Average | Head | 5.38 | Download |
| Ensemble | 2015–2100 | SSP3-7.0 | Average | Water table depth | 5.38 | Download |
| Ensemble | 2015–2100 | SSP3-7.0 | Annual | Head | 68.95 | Download |
| Ensemble | 2015–2100 | SSP3-7.0 | Annual | Water table depth | 78.81 | Download |
| Ensemble | 2015–2100 | SSP3-7.0 | Monthly | Head | 826.59 | Download |
| Ensemble | 2015–2100 | SSP3-7.0 | Monthly | Water table depth | 945.03 | Download |
| Ensemble | 2015–2100 | SSP5-8.5 | Average | Head | 5.38 | Download |
| Ensemble | 2015–2100 | SSP5-8.5 | Average | Water table depth | 5.38 | Download |
| Ensemble | 2015–2100 | SSP5-8.5 | Annual | Head | 68.95 | Download |
| Ensemble | 2015–2100 | SSP5-8.5 | Annual | Water table depth | 78.80 | Download |
| Ensemble | 2015–2100 | SSP5-8.5 | Monthly | Head | 826.57 | Download |
| Ensemble | 2015–2100 | SSP5-8.5 | Monthly | Water table depth | 944.98 | Download |
| GFDL-ESM4 | 1960–2014 | CMIP6 historical | Average | Head | 5.38 | Download |
| GFDL-ESM4 | 1960–2014 | CMIP6 historical | Average | Water table depth | 5.38 | Download |
| GFDL-ESM4 | 1960–2014 | CMIP6 historical | Annual | Head | 43.99 | Download |
| GFDL-ESM4 | 1960–2014 | CMIP6 historical | Annual | Water table depth | 50.45 | Download |
| GFDL-ESM4 | 2015–2100 | SSP1-2.6 | Average | Head | 5.38 | Download |
| GFDL-ESM4 | 2015–2100 | SSP1-2.6 | Average | Water table depth | 5.38 | Download |
| GFDL-ESM4 | 2015–2100 | SSP1-2.6 | Annual | Head | 68.89 | Download |
| GFDL-ESM4 | 2015–2100 | SSP1-2.6 | Annual | Water table depth | 78.85 | Download |
| GFDL-ESM4 | 2015–2100 | SSP3-7.0 | Average | Head | 5.38 | Download |
| GFDL-ESM4 | 2015–2100 | SSP3-7.0 | Average | Water table depth | 5.38 | Download |
| GFDL-ESM4 | 2015–2100 | SSP3-7.0 | Annual | Head | 68.90 | Download |
| GFDL-ESM4 | 2015–2100 | SSP3-7.0 | Annual | Water table depth | 78.85 | Download |
| GFDL-ESM4 | 2015–2100 | SSP5-8.5 | Average | Head | 5.38 | Download |
| GFDL-ESM4 | 2015–2100 | SSP5-8.5 | Average | Water table depth | 5.38 | Download |
| GFDL-ESM4 | 2015–2100 | SSP5-8.5 | Annual | Head | 68.89 | Download |
| GFDL-ESM4 | 2015–2100 | SSP5-8.5 | Annual | Water table depth | 78.85 | Download |
| IPSL-CM6A-LR | 1960–2014 | CMIP6 historical | Average | Head | 5.38 | Download |
| IPSL-CM6A-LR | 1960–2014 | CMIP6 historical | Average | Water table depth | 5.38 | Download |
| IPSL-CM6A-LR | 1960–2014 | CMIP6 historical | Annual | Head | 43.98 | Download |
| IPSL-CM6A-LR | 1960–2014 | CMIP6 historical | Annual | Water table depth | 50.45 | Download |
| IPSL-CM6A-LR | 2015–2100 | SSP1-2.6 | Average | Head | 5.38 | Download |
| IPSL-CM6A-LR | 2015–2100 | SSP1-2.6 | Average | Water table depth | 5.38 | Download |
| IPSL-CM6A-LR | 2015–2100 | SSP1-2.6 | Annual | Head | 68.87 | Download |
| IPSL-CM6A-LR | 2015–2100 | SSP1-2.6 | Annual | Water table depth | 78.83 | Download |
| IPSL-CM6A-LR | 2015–2100 | SSP3-7.0 | Average | Head | 5.38 | Download |
| IPSL-CM6A-LR | 2015–2100 | SSP3-7.0 | Average | Water table depth | 5.38 | Download |
| IPSL-CM6A-LR | 2015–2100 | SSP3-7.0 | Annual | Head | 68.93 | Download |
| IPSL-CM6A-LR | 2015–2100 | SSP3-7.0 | Annual | Water table depth | 78.85 | Download |
| IPSL-CM6A-LR | 2015–2100 | SSP5-8.5 | Average | Head | 5.38 | Download |
| IPSL-CM6A-LR | 2015–2100 | SSP5-8.5 | Average | Water table depth | 5.38 | Download |
| IPSL-CM6A-LR | 2015–2100 | SSP5-8.5 | Annual | Head | 68.92 | Download |
| IPSL-CM6A-LR | 2015–2100 | SSP5-8.5 | Annual | Water table depth | 78.84 | Download |
| MPI-ESM1-2-HR | 1960–2014 | CMIP6 historical | Average | Head | 5.38 | Download |
| MPI-ESM1-2-HR | 1960–2014 | CMIP6 historical | Average | Water table depth | 5.38 | Download |
| MPI-ESM1-2-HR | 1960–2014 | CMIP6 historical | Annual | Head | 43.99 | Download |
| MPI-ESM1-2-HR | 1960–2014 | CMIP6 historical | Annual | Water table depth | 50.45 | Download |
| MPI-ESM1-2-HR | 2015–2100 | SSP1-2.6 | Average | Head | 5.38 | Download |
| MPI-ESM1-2-HR | 2015–2100 | SSP1-2.6 | Average | Water table depth | 5.38 | Download |
| MPI-ESM1-2-HR | 2015–2100 | SSP1-2.6 | Annual | Head | 68.91 | Download |
| MPI-ESM1-2-HR | 2015–2100 | SSP1-2.6 | Annual | Water table depth | 78.85 | Download |
| MPI-ESM1-2-HR | 2015–2100 | SSP3-7.0 | Average | Head | 5.38 | Download |
| MPI-ESM1-2-HR | 2015–2100 | SSP3-7.0 | Average | Water table depth | 5.38 | Download |
| MPI-ESM1-2-HR | 2015–2100 | SSP3-7.0 | Annual | Head | 68.93 | Download |
| MPI-ESM1-2-HR | 2015–2100 | SSP3-7.0 | Annual | Water table depth | 78.85 | Download |
| MPI-ESM1-2-HR | 2015–2100 | SSP5-8.5 | Average | Head | 5.38 | Download |
| MPI-ESM1-2-HR | 2015–2100 | SSP5-8.5 | Average | Water table depth | 5.38 | Download |
| MPI-ESM1-2-HR | 2015–2100 | SSP5-8.5 | Annual | Head | 68.92 | Download |
| MPI-ESM1-2-HR | 2015–2100 | SSP5-8.5 | Annual | Water table depth | 78.84 | Download |
| MRI-ESM2-0 | 1960–2014 | CMIP6 historical | Average | Head | 5.38 | Download |
| MRI-ESM2-0 | 1960–2014 | CMIP6 historical | Average | Water table depth | 5.38 | Download |
| MRI-ESM2-0 | 1960–2014 | CMIP6 historical | Annual | Head | 43.98 | Download |
| MRI-ESM2-0 | 1960–2014 | CMIP6 historical | Annual | Water table depth | 50.45 | Download |
| MRI-ESM2-0 | 2015–2100 | SSP1-2.6 | Average | Head | 5.38 | Download |
| MRI-ESM2-0 | 2015–2100 | SSP1-2.6 | Average | Water table depth | 5.38 | Download |
| MRI-ESM2-0 | 2015–2100 | SSP1-2.6 | Annual | Head | 68.97 | Download |
| MRI-ESM2-0 | 2015–2100 | SSP1-2.6 | Annual | Water table depth | 78.87 | Download |
| MRI-ESM2-0 | 2015–2100 | SSP3-7.0 | Average | Head | 5.38 | Download |
| MRI-ESM2-0 | 2015–2100 | SSP3-7.0 | Average | Water table depth | 5.38 | Download |
| MRI-ESM2-0 | 2015–2100 | SSP3-7.0 | Annual | Head | 68.99 | Download |
| MRI-ESM2-0 | 2015–2100 | SSP3-7.0 | Annual | Water table depth | 78.88 | Download |
| MRI-ESM2-0 | 2015–2100 | SSP5-8.5 | Average | Head | 5.38 | Download |
| MRI-ESM2-0 | 2015–2100 | SSP5-8.5 | Average | Water table depth | 5.38 | Download |
| MRI-ESM2-0 | 2015–2100 | SSP5-8.5 | Annual | Head | 68.99 | Download |
| MRI-ESM2-0 | 2015–2100 | SSP5-8.5 | Annual | Water table depth | 78.88 | Download |
| UKESM1-0-LL | 1960–2014 | CMIP6 historical | Average | Head | 5.38 | Download |
| UKESM1-0-LL | 1960–2014 | CMIP6 historical | Average | Water table depth | 5.38 | Download |
| UKESM1-0-LL | 1960–2014 | CMIP6 historical | Annual | Head | 44.00 | Download |
| UKESM1-0-LL | 1960–2014 | CMIP6 historical | Annual | Water table depth | 50.46 | Download |
| UKESM1-0-LL | 2015–2100 | SSP1-2.6 | Average | Head | 5.38 | Download |
| UKESM1-0-LL | 2015–2100 | SSP1-2.6 | Average | Water table depth | 5.38 | Download |
| UKESM1-0-LL | 2015–2100 | SSP1-2.6 | Annual | Head | 68.93 | Download |
| UKESM1-0-LL | 2015–2100 | SSP1-2.6 | Annual | Water table depth | 78.85 | Download |
| UKESM1-0-LL | 2015–2100 | SSP3-7.0 | Average | Head | 5.38 | Download |
| UKESM1-0-LL | 2015–2100 | SSP3-7.0 | Average | Water table depth | 5.38 | Download |
| UKESM1-0-LL | 2015–2100 | SSP3-7.0 | Annual | Head | 68.97 | Download |
| UKESM1-0-LL | 2015–2100 | SSP3-7.0 | Annual | Water table depth | 78.86 | Download |
| UKESM1-0-LL | 2015–2100 | SSP5-8.5 | Average | Head | 5.38 | Download |
| UKESM1-0-LL | 2015–2100 | SSP5-8.5 | Average | Water table depth | 5.38 | Download |
| UKESM1-0-LL | 2015–2100 | SSP5-8.5 | Annual | Head | 68.97 | Download |
| UKESM1-0-LL | 2015–2100 | SSP5-8.5 | Annual | Water table depth | 78.86 | Download |
Quality assurance
Archive
YODA landing page
Static quality flags: karst aquifers, mountainous regions and permafrost, each held as a separate variable. These are the settings where the model’s physical assumptions hold least well.
Spin-up completion: the month, as
YYYYMM, at which spin-up is achieved for each cell. Output earlier than that month has not equilibrated and should not be used.GRACE agreement: categorical classes recording where GRACE observations agree with the modelled storage change.
Loading ITables v2.9.1 from the init_notebook_mode cell...
(need help?)
|
| ⓘItem | Contents | Size (MiB) | Download |
|---|---|---|---|
| Static quality flags | Karst aquifers, mountainous regions and permafrost, each as a separate variable | 24.46 | Download |
| Spin-up completion | Month (YYYYMM) at which spin-up is achieved for each cell | 49.08 | Download |
| GRACE agreement | Categorical classes recording where GRACE agrees with the modelled storage change | 0.13 | Download |